Category: data visualization

  • India’s Electric Vehicle Revolution: A 5-Year Growth Story

    India’s Electric Vehicle Revolution: A 5-Year Growth Story


    India has embarked on an exciting journey toward greener transportation, and the numbers tell an impressive story. Over the past five years, the adoption of electric vehicles (EVs) has skyrocketed, signaling a significant shift in how Indians perceive sustainable mobility.

    This chart illustrate the Year-wise Number of Registered Electric Vehicles as per e-vahan Portal from 2019-20 to 2023-24. The highest number of registered Electric Vehicles as per e-vahan Portal was 16,81,127 in the year 2023-24 and the lowest number of registered Electric Vehicles as per e-vahan Portal was 1,42,383 in the year 2020-21.

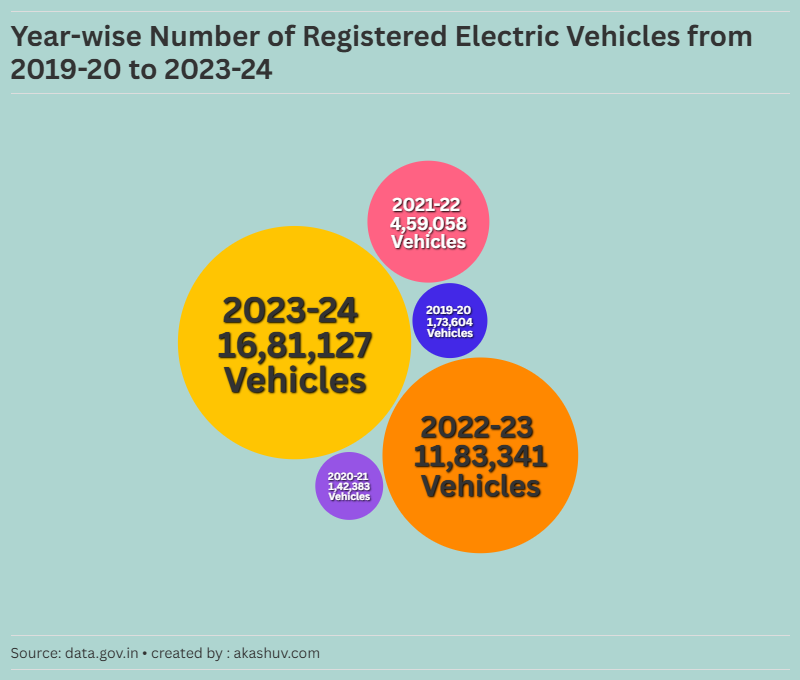
    Here’s a year-by-year look at the growth in EV registrations:

    Fiscal YearRegistered EVs
    2019-20173,604
    2020-21142,383
    2021-22459,058
    2022-231,183,341
    2023-241,681,127

    Source – RAJYA SABHA SESSION – 265 UNSTARRED QUESTION No 1355. ANSWERED ON, 2nd August 2024. Data Figures are in Number.

    Dataset URL: https://www.data.gov.in/resource/year-wise-number-registered-electric-vehicles-e-vahan-portal-2019-20-2023-24

    What the Numbers Reveal

    The data paints an inspiring picture:

    1. 2019-20 to 2020-21: A Temporary Dip
      During the pandemic years, EV registrations saw a slight dip of about 18%, largely due to the economic slowdown and logistical challenges. This was expected as consumer spending shifted to essentials.
    2. 2020-21 to 2021-22: A Triple Leap Forward
      As the economy started bouncing back, EV registrations tripled. This marked a turning point, with Indians becoming more receptive to the idea of electric mobility.
    3. 2021-22 to 2022-23: The Big Boom
      The following year saw registrations nearly triple again, reflecting heightened awareness, better infrastructure, and improved government incentives.
    4. 2022-23 to 2023-24: Sustained Momentum
      The upward trend continued, with a growth rate of over 40% in just one year. It’s clear that EVs are no longer a niche—electric mobility is becoming mainstream.

    Why India is Charging Ahead with EVs

    Several factors are driving this remarkable growth:

    1. Government Push
      The FAME India Scheme (Faster Adoption and Manufacturing of Hybrid and Electric Vehicles) has been a game-changer. Under FAME II, rolled out in 2019, subsidies and incentives have made EVs more affordable. For instance, as of July 2023, over 832,000 EVs were sold through this scheme, covering two-wheelers, three-wheelers, and four-wheelers.
    2. Improved Charging Infrastructure
      Charging anxiety has been a big hurdle for EV adoption, but things are changing. The government has sanctioned nearly 4,500 EV charging stations across cities and highways, making it easier for EV owners to hit the road without worry.
    3. State-Level Support
      Many Indian states have introduced their own EV policies. From tax waivers to purchase subsidies, these initiatives are making EVs accessible to a broader audience.
    4. Rising Consumer Awareness
      Indians are increasingly prioritizing sustainability and long-term savings. With lower running costs and environmental benefits, EVs are becoming the smarter choice for many families and businesses.

    The Road Ahead

    The leap from 173,604 EVs in 2019-20 to over 1.6 million in 2023-24 is extraordinary. However, this is just the beginning. With technological advancements, better battery efficiency, and continuous government backing, the EV revolution in India is set to accelerate further.

    As consumers, businesses, and policymakers align on the need for sustainable transportation, India could very well become a global leader in the electric mobility sector. The future is electric, and the time to switch gears is now!


    Reference: https://pib.gov.in/

    Read related blog: Safeguarding the Maritime Nation: Achievements of the Indian Coast Guard

    Kerala District wise Per Capita income in 2022-23

  • Kerala District wise Per Capita income in 2022-23

    Kerala District wise Per Capita income in 2022-23


    Understanding the Four Indicators of Per Capita Income

    Before diving into the district-wise per capita income in Kerala for 2022-23, let’s simplify the key metrics used to calculate and represent this economic indicator.

    Per capita income measures the average income earned per person in a region over a specific period.

    The per capita income can be calculated using this equation:

    \text{Per Capita Income} = \frac{\text{Total Income}}{\text{Population}}

    In this formula, the total income represents the aggregate income earned by all individuals in the region, and the population represents the total number of people in that region.

    Essentially, it’s a way to get an average income per person.


    Here, we’ll break down the four important indicators with relatable examples to make these concepts clear to everyone, even if economics isn’t your strong suit.


    1. Per Capita – GDVA at Constant Price (2022-23)

    What It Means

    This measures the per capita Gross Domestic Value Added (GDVA) in “real” terms, adjusted for inflation. It’s like comparing the price of mangoes today to how much they cost five years ago, without the inflation factor distorting the comparison.

    Example Story

    Imagine Ravi runs a small business selling handmade pottery. If he earned ₹1,00,000 in 2020 and ₹1,20,000 in 2023, that increase may not mean much if prices for raw materials, fuel, and other expenses also went up. Adjusting for inflation lets us see if Ravi actually produced more value or just earned more nominal money.

    Why It’s Important

    • It shows the true economic growth in a region.
    • Helps policymakers focus on improving real income rather than just chasing higher numbers.

    2. Per Capita - GDVA at Current Price (2022-23)

    What It Means

    This metric looks at the per capita GDVA in “nominal” terms, i.e., without adjusting for inflation. It reflects the income based on the prices during the year 2022-23.

    Example Story

    Neha’s bakery earned ₹50,000 last year, and this year she made ₹60,000. However, she noticed that the price of ingredients like flour and sugar also increased significantly. This number (₹60,000) represents her income at current prices, but it doesn’t tell if she truly did better or if inflation just made her revenue seem higher.

    Why It’s Important

    • Gives a snapshot of the immediate economic situation.
    • Useful for understanding purchasing power and overall monetary trends.

    3. Per Capita - NDVA at Constant Price (2022-23)

    What It Means

    This measures the per capita Net Domestic Value Added (NDVA) in real terms, adjusted for inflation. NDVA differs from GDVA because it accounts for the depreciation of assets, meaning it considers the wear and tear on machinery, buildings, or tools used for production.

    Example Story

    Think of Ramesh, a farmer who uses a tractor to plow his fields. Over the years, the tractor needs repairs or replacement parts. NDVA at constant prices tells us how much net value Ramesh added to the economy after accounting for these maintenance costs, adjusted for inflation.

    Why It’s Important

    • Focuses on sustainable economic growth.
    • Helps governments and businesses plan for long-term investments.

    4. Per Capita - NDVA at Current Price (2022-23)

    What It Means

    This shows the per capita NDVA in nominal terms, calculated at the prices prevailing in 2022-23, without adjusting for inflation. It’s useful for assessing net income in absolute terms.

    Example Story

    Lakshmi owns a textile shop. Over the past year, her shop’s revenue grew significantly. However, her sewing machines needed upgrades, which reduced her actual earnings. NDVA at current prices gives a sense of her net income for the year, though it doesn’t account for rising costs due to inflation.

    Why It’s Important

    • Provides insight into immediate economic well-being.
    • Useful for short-term planning and financial analysis.

    Why These Indicators Matter

    Comparative Analysis

    By examining both constant and current price metrics, we can separate real economic growth from inflation’s effects. For example, if Kerala’s per capita GDVA at constant prices increases by 5%, it means real growth. However, if the increase is only in current prices, inflation might be the culprit.

    Gross vs. Net Measures

    • Gross indicators show the overall economic activity.
    • Net indicators provide a clearer picture of sustainable income by factoring in depreciation.

    Policy Implications

    These metrics help policymakers:

    • Address regional disparities (e.g., why does one district in Kerala have higher per capita income than another?).
    • Allocate resources efficiently.
    • Identify areas needing targeted economic interventions.

    A Kerala-Specific Example

    Let’s consider two districts in Kerala:

    • District A has a per capita GDVA at constant prices of ₹90,000 and a per capita NDVA at constant prices of ₹75,000.
    • District B has a per capita GDVA at constant prices of ₹80,000 and a per capita NDVA at constant prices of ₹65,000.

    What does this tell us? While both districts show similar economic activity, District A’s higher NDVA suggests better asset management and sustainable income generation. Policymakers could focus on helping District B improve its infrastructure to reduce depreciation costs.


    Conclusion

    Understanding these four indicators of per capita income helps us see the bigger picture of economic growth and well-being. By focusing on real income (constant prices) and sustainable value (net measures), we can make informed decisions for a prosperous future.

    Do you have a specific district or metric in Kerala you’d like to explore further?

    Please visit the website ; https://www.ecostat.kerala.gov.in/

    for analyzing economic health and productivity on both a national and regional level.

    Citations:
    [1] https://www.drishtiias.com/daily-news-analysis/gross-value-added
    [2] https://pib.gov.in/PressReleaseIframePage.aspx?PRID=1942055
    [3] https://www.investopedia.com/terms/g/gross-value-added.asp
    [4] https://www.mospi.gov.in/sites/default/files/press_release/PressNoteGDP31052024.pdf

    Check out our blog on MBA: Click here